Comprehensive Guide to Email Analytics and Metrics

Email Analytics and Metrics are the backbone of any successful email marketing campaign. By understanding the data behind your emails, you can make informed decisions that improve engagement, deliverability, and overall campaign performance. This comprehensive guide will walk you through everything you need to know about Email Analytics and Metrics, covering essential metrics, advanced analytics, tools, best practices, and real-life examples to help you leverage data for better results.
Understanding Email Analytics and Metrics
What is Email Analytics?
Email analytics involves tracking and analysing various metrics to understand how your email campaigns are performing. By measuring key data points, you can gain insights into what works and what doesn’t, allowing you to refine your strategies and achieve your marketing goals.
The Evolution of Email Analytics
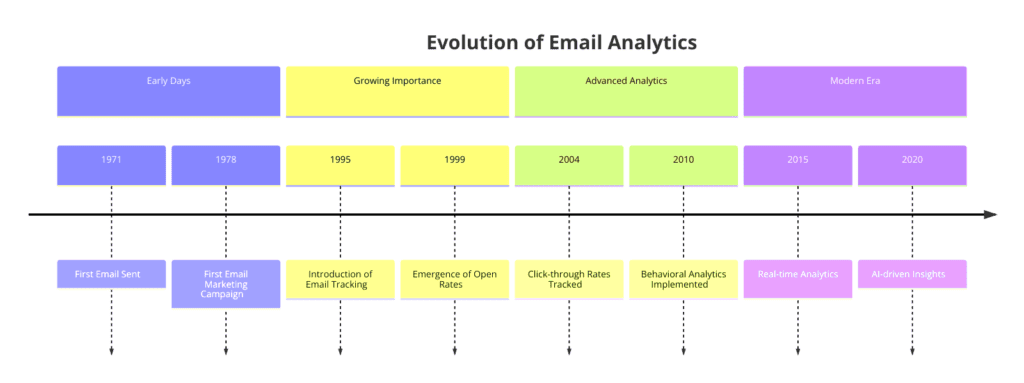
Email analytics has come a long way since the early days of email marketing. In the past, marketers relied on basic metrics like open rates and click-through rates to gauge the success of their campaigns. However, as technology advanced and consumer behaviour changed, more sophisticated analytics tools emerged, enabling marketers to track a wider range of metrics and gain deeper insights into subscriber engagement.
Today, email analytics encompasses traditional metrics and advanced data points like subscriber lifetime value, email engagement score, and revenue per email. These metrics allow marketers to take a more holistic approach to email marketing, optimising their campaigns for long-term success and maximum ROI.
Why Email Analytics Matter for Your Campaigns
Email analytics provide crucial insights that can help you:
- Optimise subject lines and content to increase open and click-through rates.
- Segment your audience for more personalised and relevant messaging.
- Reduce bounce rates and spam complaints to maintain a healthy sender reputation.
- Measure conversions to understand the effectiveness of your calls to action.
- Track list growth and engagement to ensure your audience is growing and staying engaged.
Understanding and acting upon these insights can significantly enhance the effectiveness of your email marketing efforts, ultimately driving business growth and improving your bottom line.
Key Email Metrics to Track
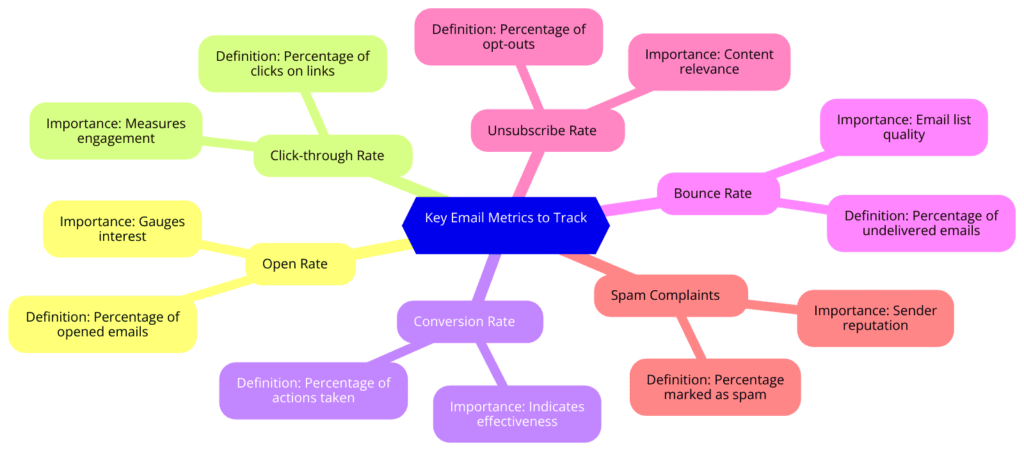
Open Rate
Definition and Importance
The open rate is the percentage of recipients who open your email. This metric helps you understand how well your subject lines and preheaders perform. A higher open rate indicates that your subject lines are compelling and relevant to your audience.
Example: If you email 1,000 subscribers and 200 of them open it, your open rate would be 20%.
How to Improve Open Rates
- Craft engaging and relevant subject lines that pique subscribers’ interest.
- Personalise your emails by including the recipient’s name in the subject line.
- Test different send times to determine when your audience will likely open emails.
- Use A/B testing to find the most effective subject lines and optimise for higher opens.
- Ensure your sender name is recognisable and trusted to avoid being marked as spam.
Click-Through Rate (CTR)
Definition and Significance
CTR measures the percentage of email recipients who clicked on one or more links within your email. It indicates the effectiveness of your email content and design in encouraging recipients to take action.
Example: If 100 recipients open your email and 20 of them click on a link, your CTR would be 20%.
Strategies to Boost CTR
- Use clear and compelling calls to action (CTAs) that attract clicks.
- Include visually appealing and clickable elements like buttons and images.
- Personalise content based on recipient interests and behaviour to increase relevance.
- Segment your email list to send more targeted messages that resonate with each group.
- Regularly test different content formats and CTAs to see what works best for your audience.
Conversion Rate
Understanding Conversion Rates
The conversion rate is the percentage of recipients completing a desired action after clicking through your email, such as purchasing or filling out a form. This metric directly ties your email efforts to business outcomes.
Example: If 50 recipients click on a link in your email and 10 of them make a purchase, your conversion rate would be 20%.
Tips to Increase Conversion Rates
- Simplify your conversion process to make it easy for recipients to complete the desired action.
- Use persuasive and benefit-focused language in your CTAs to encourage action.
- Optimise your landing pages for conversions by ensuring they are relevant to the email content and offer a seamless user experience.
- Leverage social proof such as testimonials and reviews to build trust and credibility.
- Offer incentives like discounts or exclusive content to motivate conversions.
Bounce Rate
Types of Bounces: Hard vs. Soft
- Hard Bounce: A permanently undeliverable email, usually due to an invalid email address. To maintain a clean database, hard bounces should be removed from your list immediately.
- Soft Bounce: A temporarily undeliverable email due to issues like a full inbox or server problems. These addresses can be retried a few times before being removed.
Methods to Reduce Bounce Rates
- Regularly clean your email list to remove invalid or outdated addresses that cause hard bounces.
- Use double opt-in to ensure subscribers provide valid email addresses and are genuinely interested in your content.
- Monitor your bounce rates and take action on addresses that consistently bounce to avoid damaging your sender’s reputation.
- Verify email addresses at the point of collection to catch typos or invalid entries before they enter your database.
- Maintain a good sender reputation by following best practices for email deliverability and avoiding spammy behaviour.
Unsubscribe Rate
Definition and Importance
The unsubscribe rate is the percentage of recipients who opt out of your mailing list. This metric indicates how well your content resonates with your audience and helps identify areas where you might lose subscribers.
Example: If 5 recipients unsubscribe from your email list of 1,000 subscribers, your unsubscribe rate would be 0.5%.
Best Practices to Minimise Unsubscribe Rates
- Send relevant and valuable content that matches subscriber interests and expectations.
- Use segmentation to tailor your emails to different audience groups based on their preferences and behaviour.
- Maintain a consistent sending schedule to avoid overwhelming your subscribers with too many emails.
- Make it easy to update preferences instead of unsubscribing altogether, giving subscribers control over the content they receive.
- Analyse feedback from unsubscribed users to identify common reasons and improve future emails accordingly.
Spam Complaint Rate
Definition and Importance
The spam complaint rate measures the percentage of recipients who mark your email as spam. This metric impacts your sender’s reputation and deliverability, making it crucial to monitor and manage.
Example: If 2 recipients mark your email as spam out of 1,000 delivered emails, your spam complaint rate would be 0.2%.
Ways to Lower Spam Complaints
- Ensure clear and honest subject lines that accurately reflect the email content and avoid any misleading or spammy language.
- Provide a visible and easy-to-use unsubscribe option in every email so that recipients can opt out if they no longer wish to receive your emails.
- Only send emails to users who have explicitly opted in to receive them, and avoid purchasing or renting email lists.
- Use a recognisable sender name and email address that recipients will trust and associate with your brand.
- Regularly clean your email list to remove inactive or unengaged subscribers who are more likely to mark your emails as spam.
Advanced Email Metrics
Click-to-Open Rate (CTOR)
What It Tells You About Engagement
CTOR is the percentage of email recipients who clicked on a link within the email after opening it. This metric helps you understand how engaging and relevant your email content is once the recipient has opened it.
Example: If 200 recipients open your email and 50 of them click on a link, your CTOR would be 25%.
Techniques to Improve CTOR
- Personalise email content beyond the subject line to make the email more relevant and engaging for each recipient.
- Create compelling and clear CTAs encouraging recipients to click through and take action.
- Use engaging visuals like images, videos, and GIFs to highlight key links and make the email more visually appealing.
- Test different email designs and layouts to find the most effective format for your audience.
- Segment your audience based on their interests, behaviour, and preferences to send more targeted and relevant messaging.
Revenue per Email (RPE)
Measuring Email Marketing ROI
RPE measures the average revenue generated per email sent. It helps you understand the direct financial impact of your email marketing efforts and optimise for maximum ROI.
Example: If your email campaign generates R1,000 in revenue and you sent the email to 5,000 subscribers, your RPE would be R0.20.
How to Improve RPE
- Segment your email list to send more targeted and relevant offers that will likely convert into sales.
- Use personalization and dynamic content to show recipients products or services that are most relevant to their interests and behaviour.
- Test different subject lines, content, and CTAs to find the most effective combination for driving revenue.
- Optimise your email design and layout to make it easy for recipients to click through and make a purchase.
- Analyze your email metrics and use the insights to refine your strategy for maximum revenue generation continually.
Email Engagement Score
A Holistic Measure of Subscriber Engagement
The email engagement score is a composite metric that considers various engagement metrics, such as opens, clicks, and conversions, to provide an overall picture of each subscriber is engagement with your emails.
Example: An engagement score might be calculated by assigning points for different actions (e.g., 1 point for an open, 5 points for a click, 10 points for a conversion) and then aggregating these points for each subscriber over a given period.
Using Engagement Scores to Optimise Campaigns
- Segment your email list based on engagement scores to send more targeted content and offers to each group.
- Identify your most engaged subscribers and nurture them with exclusive content, offers, or rewards to turn them into loyal customers and brand advocates.
- Re-engage inactive subscribers with special offers or incentives to bring them back into the fold and avoid losing them entirely.
- Monitor changes in engagement scores over time to identify trends and adjust your email strategy accordingly.
- Use engagement scores to optimise your email sending frequency and cadence for each subscriber based on their level of engagement.
Mobile Open Rate
The Importance of Mobile Optimization
The mobile open rate measures the percentage of emails opened on mobile devices. As more people access their emails on smartphones and tablets, optimizing for mobile has become crucial for email marketing success.
Example: If 500 recipients open your email and 300 of them do so on a mobile device, your mobile open rate would be 60%.
Strategies for Mobile Optimization
- Use a responsive email design that adapts to different screen sizes and ensures your emails look great on any device.
- Keep your subject lines short and compelling to ensure they aren’t cut off on smaller mobile screens.
- Use large, touch-friendly buttons for your CTAs to make it easy for mobile users to click through.
- Optimise your email content for mobile with a single-column layout, larger fonts, and mobile-friendly images.
- Test your emails on various mobile devices to ensure they render correctly and provide a seamless user experience.
Analysing Campaign Performance
Setting Up Goals and KPIs
Aligning Metrics with Business Objectives
To effectively analyse your email campaign performance, you must set clear goals and KPIs aligning with your overall business objectives. Common goals for email marketing include:
- Increasing website traffic: Measured by click-through rates and website visits from email.
- Generating leads: Measured by form submissions, downloads, or sign-ups from email.
- Boosting sales: Measured by email-driven purchases, revenue per email, and conversion rates.
- Improving brand awareness: Measured by email open rates, forwards, and shares.
Using Analytics Tools for Tracking
You’ll need to use email analytics tools like Google Analytics, Mailchimp, or HubSpot to track your email metrics and KPIs. These tools allow you to:
- Set up tracking codes to measure email-driven website traffic and conversions.
- Integrate with your email service provider to automatically pull in email performance data.
- Create custom dashboards and reports to visualize your email metrics and track progress towards your goals.
- Segment your email data by campaign, audience, or other criteria to gain deeper insights into performance.
Analyzing Email Performance Metrics
Identifying Trends and Patterns
Once you have your email analytics set up, it’s important to regularly review your metrics and look for trends and patterns that can inform your strategy. Some key things to look for include:
- Changes in open, click-through, and conversion rates over time: Are they improving, declining, or staying steady?
- Differences in performance between different segments or campaigns: Which audiences or types of emails are performing best?
- Spikes or drops in metrics around specific events or dates: Did a particular holiday campaign or product launch drive a surge in engagement?
Using Data to Inform Email Optimization
Based on the trends and patterns you identify, you can start to make data-driven optimizations to your email campaigns, such as:
- Adjusting your subject lines or sender name to improve open rates.
- Changing your email design, layout, or content to boost click-through rates and engagement.
- Tweaking your offers, pricing, or calls to action to increase conversion rates and revenue.
- Segmenting your audience differently or sending more targeted campaigns based on performance data.
Segmentation and Personalisation
Benefits of Targeted Campaigns
Segmenting your email list and sending targeted, personalized campaigns can greatly impact email performance. Some key benefits of segmentation and personalization include:
- Higher open and click-through rates: Recipients are more likely to engage with emails that are relevant and tailored to their interests.
- Better conversion rates: Personalized offers and content are more likely to drive purchases and other desired actions.
- Improved subscriber retention: When they receive targeted, valuable content, subscribers are less likely to tune out or unsubscribe.
- More efficient use of resources: Focusing your efforts on the most effective segments and campaigns can yield better results with less waste.
Techniques for Effective Segmentation
Depending on your business goals and audience, there are many ways to segment your email list for more targeted campaigns.
Some common segmentation techniques include:
- Demographic segmentation: Based on age, gender, location, income, or other demographic factors.
- Behavioural segmentation: Based on past purchases, email engagement, website activity, or other behaviours.
- Psychographic segmentation: Based on interests, values, attitudes, or lifestyle preferences.
- Customer journey segmentation: Based on where subscribers are in the customer journey, from awareness to consideration to purchase and beyond.
- Engagement level segmentation: This is based on how actively engaged subscribers are with your emails, such as opens, clicks, or purchases.
Interpreting and Acting Upon Data
Identifying Trends and Patterns
By regularly reviewing your email metrics and segmentation data, you can start to identify trends and patterns that can inform your strategy. Some key things to look for include:
- Changes in performance over time: Are open rates, click-through rates, or conversion rates improving or declining?
- Differences between segments: Which segments perform best in engagement, conversions, or revenue?
- Seasonal or event-based trends: Are certain times of year or events driving higher engagement or sales?
Making Data-Driven Decisions
You can make data-driven decisions to optimise your email campaigns for better results based on the trends and patterns you identify. Some examples might include:
- Adjusting your email frequency based on engagement levels: Sending more emails to highly engaged subscribers and less to inactive ones.
- Tailoring your content and offers based on segment preferences: Showing different products, articles, or promotions to different segments based on their interests.
- Optimizing your sending schedule based on time-of-day performance: Sending emails at the times when each segment is most likely to open and engage.
- Reallocating resources to high-performing segments and campaigns: Focusing more of your time, budget, and effort on the best tactics, delivering the best results.
Optimising Campaigns Based on Insights
Continuously refine and optimise your email campaigns based on the insights you gain from your email analytics. This might involve:
- A/B testing different subject lines, content, or designs to see which versions perform best.
- Tweaking your segmentation criteria to create more targeted and effective audience groups.
- Adjusting your email cadence and frequency based on subscriber engagement and preferences.
- Incorporating new tactics or technologies, such as personalization, dynamic content, or interactive elements, will keep your emails fresh and engaging.
By regularly analyzing your email performance data and using it to inform your strategy and optimization efforts, you can continuously improve your email marketing results over time.
Tools for Email Analytics
Top Email Analytics Tools
Understanding the tools available for email analytics can significantly enhance your ability to track and optimise your campaigns. Here are some of the top email analytics tools:
- Google Analytics
- Features: It tracks email campaign performance, conversion rates, and user behaviour on your website and integrates with most email service providers.
- Pricing: Free for basic features, with advanced features available in Google Analytics 360 for enterprise users.
- Mailchimp
- Features: It provides detailed reports on email opens, clicks, bounces, and unsubscribes. It also includes A/B testing, segmentation, and automation tools.
- Pricing: Free for up to 2,000 contacts, with paid plans starting at R9.99/month for additional features and contacts.
- HubSpot
- Features: Comprehensive email analytics and reporting, including opens, clicks, bounces, unsubscribes, etc. Integrates with HubSpot CRM for advanced segmentation and personalization.
- Pricing: Basic email marketing features are free, with paid plans starting at R50/month for more advanced analytics and automation.
- Klaviyo
- Features: Robust email and SMS marketing analytics, including revenue tracking, segmentation, and predictive analytics. Integrates with e-commerce platforms like Shopify and Magento.
- Pricing: Free for up to 250 contacts, with paid plans starting at R20/month for additional features and contacts.
- Litmus
- Features: This email testing and analytics platform allows you to preview your emails across 90+ email clients and devices. It provides insights on email opens, clicks, and engagement.
- Pricing: Plans with basic features start at R99/month, with enterprise plans available for larger teams and organizations.
Comparison Table of Email Analytics Tools
| Feature | Google Analytics | Mailchimp | HubSpot | Klaviyo | Litmus |
|---|---|---|---|---|---|
| Email performance tracking | Yes | Yes | Yes | Yes | Yes |
| A/B testing | No | Yes | Yes | Yes | Yes |
| Segmentation | Limited | Yes | Yes | Yes | No |
| Marketing automation | No | Yes | Yes | Yes | No |
| CRM integration | Limited | No | Yes | Limited | No |
| E-commerce integration | Limited | Limited | Yes | Yes | No |
| Email client testing | No | No | No | No | Yes |
| Pricing | Free/Paid | Free/Paid | Free/Paid | Free/Paid | Paid |
Case Studies and Real-Life Examples
Case Study 1: Surefront’s Email Personalization Success
Initial Challenges
Surefront, a B2B e-commerce platform, struggled with low engagement and conversion rates from their email marketing campaigns. They sent generic, one-size-fits-all emails to their entire subscriber base, resulting in an average open rate of just 12% and a click-through rate of 2%.
Actions Taken
- Segmented their email list based on subscriber behaviour, interests, and demographics to create more targeted audience groups.
- Personalized email content and offers for each segment, using dynamic content and product recommendations based on past behaviour.
- A/B tested subject lines, content, and CTAs to optimise for higher open rates and click-through rates.
- Automated targeted email campaigns based on subscriber actions and lifecycle stages, such as welcome series, abandoned cart reminders, and post-purchase follow-ups.
Results and Insights
- Open rates increased by 40%, and click-through rates doubled within the first 3 months of implementing personalization and segmentation.
- Automated lifecycle campaigns drove a 28% increase in revenue from email marketing.
- Conversion rates for personalized product recommendations were 5x higher than generic offers.
- Surefront continues to refine their email strategy based on performance data, testing new personalization tactics and segmentation criteria to drive even better results.
Case Study 2: Charity Water’s Donor Engagement Optimization
Initial Challenges
charity: water, a non-profit organization that provides clean and safe drinking water to developing countries, relied on email marketing to engage donors and drive fundraising. However, they struggled with declining open rates and donation rates, as their emails failed to resonate with donors on a personal level.
Actions Taken
- Segmented their donor list based on factors like donation history, location, and engagement level to create more targeted email campaigns.
- Personalized email content to address each donor by name and reference their past support and impact.
- Developed a drip campaign to nurture new donors and keep them engaged over time, with personalized stories, updates, and impact reports.
- Tested different subject lines, content, and CTAs to optimize for higher open rates, click-through rates, and donation rates.
Results and Insights
- Open rates increased by 25% and click-through rates increased by 40% within the first 6 months of implementing personalization and segmentation.
- The average donation amount increased by 15% as donors felt more personally connected to the cause and impact of their contributions.
- The donor retention rate increased by 20% as the drip campaign kept donors engaged and informed over time.
- charity: water continues to use email analytics to track and optimize their donor engagement, testing new personalization tactics and segmentation criteria to maximize fundraising results.
These case studies demonstrate the power of email analytics to drive real business results through data-driven optimization and personalization. By continuously tracking, analyzing, and acting on email performance data, marketers can create more effective email campaigns that resonate with their audience and achieve their goals.
Best Practices for Email Analytics
Regular Monitoring and Reporting
Importance of Consistent Tracking
Consistently monitoring your email metrics is essential for staying on top of your email marketing performance and identifying opportunities for optimization. Some best practices for regular monitoring include:
- Setting up automated reports to track key metrics like open rates, click-through rates, and conversion rates on a daily, weekly, or monthly basis.
- Reviewing your email analytics dashboard regularly to spot trends and anomalies in your data.
- Comparing your performance to industry benchmarks to see how you stack up against other marketers in your space.
- Sharing email performance data with your team to keep everyone aligned and informed.
Creating Actionable Reports
To make your email analytics data actionable, it’s important to create reports that are easy to understand and use. Some tips for creating actionable reports include:
- Focusing on key metrics that align with your email marketing goals and KPIs.
- Using data visualization like charts and graphs to make your data more engaging and digestible.
- Providing context and commentary to explain what the data means and what actions should be taken based on the insights.
- Segmenting your data by campaign, audience, or other relevant factors to provide more granular insights.
A/B Testing
How to Conduct A/B Tests
A/B testing is a powerful way to optimize your email campaigns by comparing the performance of different versions of your emails. Here’s a step-by-step process for conducting A/B tests:
- Identify a variable to test, such as subject line, sender name, content, or CTA.
- Create two versions of your email, with one version serving as the control and the other version containing the variation you want to test.
- Split your email list into two equal and random groups, with each group receiving one version of the email.
- Send the emails and track the performance of each version using your email analytics tools.
- Analyze the results to determine which version performed better based on your chosen metrics (e.g. open rate, click-through rate, conversion rate).
- Implement the winning version for future campaigns and continue testing new variations to optimize further.
Interpreting A/B Test Results
When analyzing the results of your A/B tests, it’s important to use statistical significance to ensure that your results are reliable. Some tips for interpreting A/B test results include:
- Using a large enough sample size to ensure that your results are representative of your entire email list.
- Running tests for a long enough period to account for any fluctuations or anomalies in your data.
- Using a statistical significance calculator to determine whether the difference in performance between your two versions is statistically significant.
- Considering the practical significance of your results in addition to the statistical significance (e.g. a 1% increase in conversion rate might be statistically significant but not practically meaningful for your business).
FAQs
Common Questions About Email Metrics
What is a good open rate for email campaigns?
A good open rate varies by industry and audience, but a general benchmark is 20-30% for B2B campaigns and 15-25% for B2C campaigns. However, it’s more important to focus on improving your own open rates over time than comparing yourself to generic benchmarks.
How can I reduce my email bounce rate?
Some strategies for reducing your email bounce rate include:
- Regularly cleaning your email list to remove invalid or outdated addresses.
- Using double opt-in to ensure that subscribers are genuinely interested and engaged.
- Avoiding spammy or misleading subject lines and content that can trigger spam filters.
- Maintaining a consistent sending schedule to keep your IP reputation in good standing.
What is the difference between CTR and CTOR?
CTR (click-through rate) measures the percentage of people who clicked on a link in your email out of the total number of people who received the email. CTOR (click-to-open rate) measures the percentage of people who clicked on a link in your email out of the number of people who opened the email. CTOR is a better measure of the effectiveness of your email content and CTAs, while CTR is a better measure of the overall performance of your email campaign.
Best Practices and Troubleshooting Tips
How can I improve my email deliverability?
Some best practices for improving your email deliverability include:
- Using a reputable email service provider that follows best practices for email authentication and security.
- Keeping your email list clean and up-to-date by regularly removing bounced and unengaged addresses.
- Providing clear and easy unsubscribe options in every email to avoid spam complaints.
- Avoiding spammy subject lines, content, and formatting that can trigger spam filters.
- Maintaining a consistent sending schedule and volume to avoid sudden spikes that can alarm ISPs.
What should I do if my open rates suddenly drop?
If you notice a sudden drop in your email open rates, some troubleshooting steps to take include:
- Checking your email content and subject lines for any spammy or misleading language that could be triggering spam filters.
- Verifying that your email list is up-to-date and free of invalid or unengaged addresses that could be dragging down your performance.
- Ensuring that your email authentication and security settings are properly configured to avoid deliverability issues.
- Monitoring your sending reputation using tools like Sender Score or Return Path to identify any issues that could be impacting your deliverability.
- Testing different sending times, frequencies, and segments to see if certain factors are impacting your open rates more than others.
Quiz
- What is the difference between the open rate and the click-through rate?
a) Open rate measures the percentage of people who clicked on a link in your email, while click-through rate measures the percentage of people who opened your email.
b) Open rate measures the percentage of people who opened your email, while click-through rate measures the percentage of people who clicked on a link in your email.
c) Open rate and click-through rate are the same thing. - What is the formula for calculating the email conversion rate?
a) (Number of clicks / Number of opens) x 100
b) (Number of conversions / Number of clicks) x 100
c) (Number of conversions / Number of emails sent) x 100 - What is the difference between a hard bounce and a soft bounce?
a) A hard bounce is a temporary delivery failure, while a soft bounce is a permanent delivery failure.
b) A hard bounce is an email that bounces back to the sender, while a soft bounce is an email that gets delivered to the recipient’s spam folder.
c) A hard bounce is a permanent delivery failure, while a soft bounce is a temporary delivery failure. - What is A/B testing in email marketing?
a) Sending the same email to two lists to see which performs better.
b) Sending two different versions of an email to the same list to see which one performs better.
c) Testing different sending times to see which one gets the best open rates. - What is a good benchmark for email open rates?
a) 5-10%
b) 15-25%
c) 50-60% - What is the difference between CTR and CTOR?
a) CTR measures the percentage of people who clicked on a link out of the total number of emails sent, while CTOR measures the percentage of people who clicked on a link out of the number of people who opened the email.
b) CTR measures the percentage of people who opened the email out of the total number of emails sent, while CTOR measures the percentage of people who clicked on a link out of the number of people who opened the email.
c) CTR and CTOR are the same thing. - What is a good way to segment your email list for targeted campaigns?
a) By age and gender
b) By past purchase behaviour and engagement level
c) By email domain (e.g. Gmail vs. Yahoo) - What should you do if your email bounce rate suddenly spikes?
a) Remove all bounced addresses from your list immediately.
b) Investigate the cause of the bounces and take steps to improve your email hygiene and deliverability.
c) Ignore it and keep sending emails as usual. - What is the best time of day to send email campaigns?
a) Early morning (6am-8am)
b) Mid-day (12pm-2pm)
c) It depends on your audience and their behaviour. - What is the ideal frequency for sending email campaigns?
a) Daily
b) Weekly
c) It depends on your audience and their preferences.
Let’s End This Bad Boy
Email analytics is an important tool for any email marketer looking to optimize their campaigns and drive better results. You can gain valuable insights into what’s working and what’s not in your email strategy by tracking key metrics like open rates, click-through rates, conversion rates, and more.
But email analytics isn’t just about tracking numbers – it’s about using those numbers to make data-driven decisions that improve your email performance over time. By segmenting your audience, personalizing your content, and continuously testing and optimizing your emails, you can create more effective campaigns that resonate with your subscribers and achieve your business goals.
Whether you’re a seasoned email marketer or just getting started, investing in email analytics is a smart move that can pay off in big ways. By using the tools, techniques, and best practices covered in this comprehensive guide, you can take your email marketing to the next level and drive better results for your business.
So what are you waiting for? Start tracking, testing, and optimizing your emails today, and see how data-driven email marketing can impact your success!